You Better Watch It, Buddy
Overview
You stood up the thing, nice work! After thorough testing, you’re satisfied it does the thing to your specifications and came to the conclusion that this is the thing you’ll be using and now it’s in production. What now? Babysit it, of course. Since the thing you deployed is super important, it’s imperative that it has 100% uptime and the only way to do that is to watch it constantly so you can react when it stops doing the thing. You monitor it, around the clock, at all hours.
I’m kidding but only kind of. It’s probably safe to bet that if you spent the time conceiving and researching an idea to host something, and went through with setting it up and testing it, and then started using it, you probably care at least a little bit if it stops doing that thing. What is that thing? Soooo many things can be self-hosted today, it could be almost anything: websites, apps, containers, databases, APIs, the list goes on and on. Regardless of the thing, if you want to ensure it stays up and want to be able to react when it doesn’t then you need to monitor it. Since there’s no way of literally watching it yourself all the time, might I recommend another self-hosted solution: Uptime Kuma with alert notifications using Signal.
Uptime Kuma is simple to set up, simple to use, and you can get started with basic monitoring with very little effort or skill. I know it sounds too good to be true but it’s not - this thing is totally my bag. It’s also super light weight, it will absolutely run on a device as small as a Raspberry Pi Zero 2W (four core 1 GHz ARM processor, 1/2 GB DDR2 RAM). Simple is just one reason to use it but powerful is another. Look at all the things you can monitor:
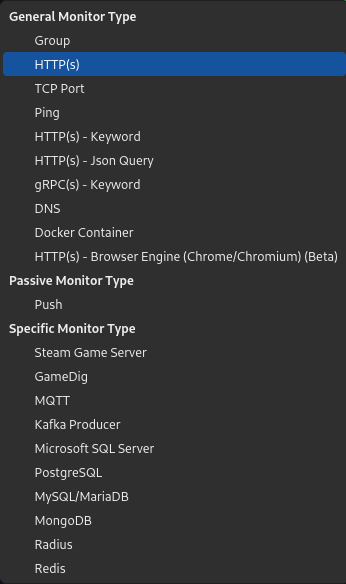
Look useful? Keep reading.
Deploy Uptime Kuma
If deploying a container is still too much commitment for you, Uptime Kuma offers a demo site to take it for a test drive. You can test pings to local machines, websites, and a few other things to get a feel for the tool and the interface. Containers are where it’s at though. This assumes you already have Docker installed.
- Create Docker Compose file:
1 2
mkdir ~/docker/uptime-kuma nano ~/docker/uptime-kuma/compose.yaml - Add this, save, and exit:
1
2
3
4
5
6
7
8
9
 services:
   uptime-kuma:
     image: louislam/uptime-kuma:1
     container_name: uptime-kuma
     volumes:
       - ./uptime-kuma-data:/app/data
     ports:
       - 3001:3001
     restart: unless-stopped
- Deploy the container:
1
docker compose -f ~/docker/uptime-kuma/compose.yaml up -d
- Open a web browser to
http://[server IP]:3001. At the login screen create your local admin account and sign in to start monitoring all the things. The password has to be somewhat secure, Uptime Kuma isn’t letting you get away with usingpassword- it must contain at least 6 alphanumeric characters (letters and numbers). You better go withpassw0rd.
Adding Some Simple Monitors
When you first login you’re met with the dashboard but there’s nothing to look at so jump right in with adding your first monitor. Click the +Add New Monitor button in the upper left.
All monitor types have some common settings:
- Monitor Type: hopefully it’s obvious that this is the type of monitor you want to use
- Friendly Name: a free form name for the monitor. It doesn’t have to be anything in particular but for your benefit you might want to give it some meaning. The server name, website, service name, or container name will work.
- Heartbeat interval: how often to check the thing. This defaults to every 60 seconds, adjust to your needs
- Retries: how many times it should check the thing before it considers it a failure. If you want to be alerted at the first sign of failure, leave this setting at the default
0. If it’s okay if Uptime Kuma misses a ping or two, then increase this accordingly. This is useful if you want the freedom to reboot a server without tripping any alerts - you can give yourself a few heartbeats of grace. - Heartbeat Retry Interval: how often it should trigger the subsequent re-checks after it fails a check. This defaults to whatever your regular heartbeat interval is.
- Resend Notification if Down X Times Consecutively: how many times do you actually want to be notified that something is down? Setting to
0means it will notify the first time it detects the thing is down but never again, not counting the notification that the thing is back up, you can increase as needed. - Upside Down Mode: the anti-monitor. This will alert you if something is UP, rather than down. I use this on my test web host. It normally hosts a static site but if I want to do some ad-hoc website testing, I take the test site container down and launch a quick Apache container. Uptime Kuma monitors the Apache container “upside down” so that I’m alerted when the dev container is running because it’s normal state should be not running.
- Monitor Groups: groups multiple monitors together, useful for bulk monitoring (all your servers, or all your websites for example).
Now let’s look at adding a few different monitor types:
- Ping - a network ping is the simplest way to get started, not to mention the cornerstone of monitoring in IT. “Does the server respond? Yes? Okay, we’re good.”:
- Monitor type: Ping
- Hostname: this can be the IP address of the server, or DNS name (such as nas.pimpnet)
- Website - slightly more advanced than the noble network ping, this monitor performs a simple HTTP GET request against the specified website. This is the equivalent of visiting a website, and what your web browser is doing behind the curtain. This call retrieves all the information there is to retrieve from a website, including data about the site which can be reported on with tools like Uptime Kuma:
- Monitor type: HTTP(s), HTTP(s) - Keyword, or HTTP(s) - Json Query
- URL: the website you want to monitor
Website monitoring is more advanced than simply up/down and Uptime Kuma has additional options for greater monitoring granularity such as TLS/SSL certificate expiry monitoring, specifying the HTTP response codes, passing along credentials, adding a keyword search (or anti-search) to the request, or specifying an API method beside GET.
- TCP Port - use this for monitoring a certain network port on a server. Standard websites use network ports
80and443. Why these two random numbers? I don’t know man. Your thing might contain some sort of web interface, which uses the default ports. But since you can only run one web service per server on those ports, apps started using alternate ports to access their interfaces. You probably noticed Uptime Kuma uses port3001to access the interface - it’s the same idea. The settings are mostly the same as the basic HTTP monitor but you also specify a port:- Monitor Type: TCP Port
- Hostname: IP/DNS name
- Port: the network port
As soon as you click Save, the monitor is live and will start performing regular checks immediately.
Monitoring Containers
Setting up a Docker Container monitor requires an additional step of adding a Docker Host, which is just any server that’s hosting containers. It can be the same server that’s running Uptime Kuma, or any other server on your network - the steps are slightly different for each. You can add a Docker Host from the Add New Monitor page or from the menu button > Settings > Docker Hosts > Setup Docker Host.
Adding the Local Docker Host
If you want Uptime Kuma to monitor the containers running on the same server as itself, you have to expose the Docker daemon to the Uptime Kuma container. You do this by mapping the Docker daemon on the local server to the UK container.
Edit the Uptime Kuma compose.yaml file, adding an additional parameter under volumes:
1
2
3
volumes:
  - ./uptime-kuma-data:/app/data
  - /var/run/docker.sock:/var/run/docker.sock
Save the file and exit, then restart the container:
1
docker restart uptime-kuma
In the Uptime Kuma Setup Docker Host screen, give it a friendly name and accept the defaults. You can click Test to ensure it works, then click Save.
Adding a Remote Docker Host
Just like the local Docker host, in order to be able to monitor the containers on another server the daemon must be exposed on that server. Please note, when you do this you are allowing the ability for Docker on that server to be managed remotely - this includes not just seeing the containers but everything else. It’s good policy to not do this on servers that are accessible from outside your local network, just saying. Since some of the containers I run are for services that are publicly accessible, I wouldn’t dream of exposing the Docker daemon on those servers. In those cases, it’s better to monitor what the container is supposed to be doing rather than the container itself. At any rate, if you do this do so with caution please. See the Uptime Kuma doc for monitoring Docker containers for more information.
On the remote Docker host, edit or create a daemon config file:
1
sudo nano /etc/docker/daemon.json
Add this, save, and exit:
1
2
3
4
{
  "tls": false,
  "hosts": ["unix:///var/run/docker.sock", "tcp://127.0.0.1:2375"]
}
Then restart the Docker daemon on that server - this WILL kill your containers momentarily but it must be done:
1
sudo systemctl restart docker.service
From Uptime Kuma, set up the remote Docker host with Connection Type TCP/HTTP, and add http://[remote Docker host]:2375. Click Test to make sure it works, then click Save.
Creating a Docker Container Monitor
Click +Add New Monitor in UK the same as before:
- Monitor Type: Docker Container
- Container Name / ID: the… container name or ID
- Docker Host: the… Docker host we just added
Setting Up Notifications
Okay, we’ve solved the ability to monitor everything from one place so you don’t have to watch those things individually. But you do still have to watch it if you want to know if something stops working. OR you can take this up a notch and receive a message when something shits the bed. There are tons of different messaging options but since I was already using Signal I went with that. Some other options include email, Slack, Telegram, Home Assistant, Discord, webhook, Twilio, Teams, PagerDuty, and OpsGenie.
Deploy the Signal CLI REST API Client
The first step is to create a Signal client, which is basically a virtual device that can send/receive Signal messages (though in this case we’re only sending). This can run on the same server as your Uptime Kuma instance or you can host it on some other server, just make sure UK can reach it on the network. What we’re standing up is a containerized version of the signal-cli app that wraps the functionality in a REST API, which Uptime Kuma uses to send the alerts that your precious pi-hole is down lol. Check out the Signal Swagger site for API usage information to see what else you can do with it.
- Create folders and Compose file:
1
2
3
mkdir ~/docker/signal-cli
mkdir ~/docker/signal-cli/signal-cli-config
nano ~/docker/signal-cli/compose.yaml
- Add this, save, and exit:
1
2
3
4
5
6
7
8
9
10
11
 services:
   signal-cli-rest-api:
     image: bbernhard/signal-cli-rest-api:latest
     container_name: signal-cli
     restart: unless-stopped
     environment:
       - MODE=normal #supported modes: json-rpc, native, normal
     ports:
       - "8080:8080" #map docker port 8080 to host port 8080.
     volumes:
       - "./signal-cli-config:/home/.local/share/signal-cli" #map "signal-cli-config" folder on host system into docker container. the folder contains the password and cryptographic keys when a new number is registered
- Deploy the container
1
docker compose -f ~/docker/signal-cli/compose.yaml up -d
- Query the API. This can be done from the UK server or from another device on the network:
1
curl -X 'GET' 'http://[signal client IP]:8080/v1/about' -H 'accept: application/json'
You should get a response like:
1
{"versions":["v1","v2"],"build":2,"mode":"native","version":"0.93","capabilities":{"v2/send":["quotes","mentions"]}}
Also did you just send your first API call? You’re no longer an API virgin, I’m so proud of you! You always remember your first.
Register Device With Signal
Before you can send any messages, the client needs to be registered with a Signal account. It’s almost criminal how easy this is.
-
Generate a Signal device registry QR code. Paste this URL into a web browser:
http://[signal client IP]:8080/v1/qrcodelink?device_name=[device name]. Device name is what you’ll see in the Signal app.NOTE - if you receive the response
error: "Couldn't create QR code: no data to encode", try a differentMODEoption in yourcompose.yamlfile. More information on the different modes is in the wiki. - Register the device:
- From your Signal app (assuming you have a Signal account and are already logged into the app), tap your user icon > Linked Devices > Link a new device
- Scan the QR code on the screen
- Tap Add device
- (optional) Send test message using the Signal client, where
numberis the Signal phone number attached to the account, andrecipientsis the guinea pig (hopefully you):1
curl -X POST -H "Content-Type: application/json" 'http://[signal client IP]:8080/v2/send' -d '{"message": "Test via Signal API!", "number": "+3211234567", "recipients": [ "+3211234568" ]}'
NOTE - the phone numbers must be entered using international telephone code syntax, hence the leading
+. In the United States that code is+1.
If you received the message, the Signal client is ready to send messages from Uptime Kuma!
Create a Notification
In the UK interface, click the menu button > Settings > Notifications > Setup Notification
- Notification Type: Signal
- Friendly Name: whatever you named the Signal client
- Post URL:
http://[signal client IP]:8080/v2/send - Number: your Signal account phone number
- Recipients: hopefully your phone number
Click Test to verify that Uptime Kuma is able to call the Signal client API to send its alert and you should receive a message [friendly name] Testing on the app. BAD ASS, RIGHT?
Toggle the two additional options Default enabled and Apply on all existing monitors to enable notifications on all new and existing monitors. This setting can be managed on a per-monitor basis as well.
Monitor the Monitor
Uptime Kuma is great and all but one thing it cannot do is alert when Uptime Kuma is down. Therefore it’s a good idea to set up a redundant instance on another server. Since I had already set up a test container (and have a million fucking devices everywhere), I just left it running so I can use it as my prod monitor. If the Signal client is running on the same server as Uptime Kuma and that server goes down, your backup UK won’t be able to alert you so you need to run a redundant Signal container too. Again, these apps are so lightweight a $15 Raspberry Pi Zero 2 W can run them. A new UK deployment uses about 40 MB of system memory, and after adding over 30 monitors my container still only consumes ~180 MB total. And Signal mostly does nothing, just sits around waiting for a new alert to come in. It’s a pretty laid back gig.
You can monitor Uptime Kuma in a couple of different ways. The same really goes for any service you run:
- Monitor the service by adding a TCP Port monitor, using the IP or network address of the server running UK and port
3001. - If you’re running Uptime Kuma in a container and the Docker daemon is exposed on the host, you can add the host as a Docker host to your redundant UK and monitor the prod container.
- Use a ping monitor on the host running UK.
Create a monitor for the Signal client, while you’re at it:
- Monitor Type: HTTP(s)
- URL:
http://[signal client IP]:8080/v1/about - Headers: add this:
1
2
3
{
  "accept": "application/json"
}
Then click Save. This performs the same HTTP check as the website monitors but since we’re querying an API endpoint explicitly (rather than performing a standard web request), we need to send along extra info in the request so the server knows that it can respond to the request with JSON. APIs are fun!
Other Useful Features
As if all of this functionality wasn’t enough, Uptime Kuma threw in some enterprise features for good measure:
-
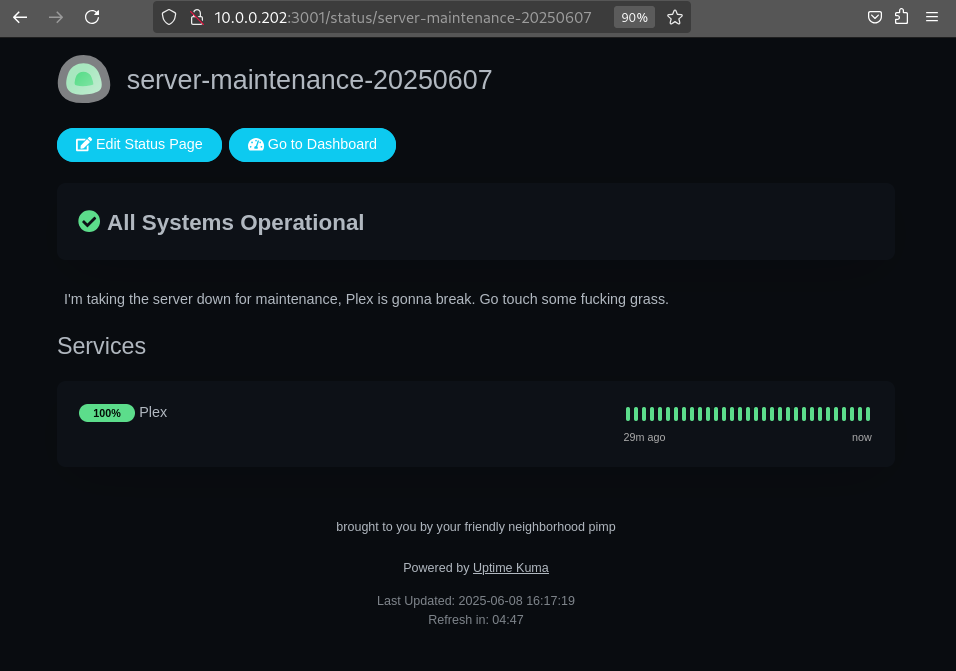
Status Pages - it seems only slightly obnoxious to point your kids/partner/roommates to your own status page if, say, Plex was going to be down for 2 minutes but you can totally do that. Here is an example:
-
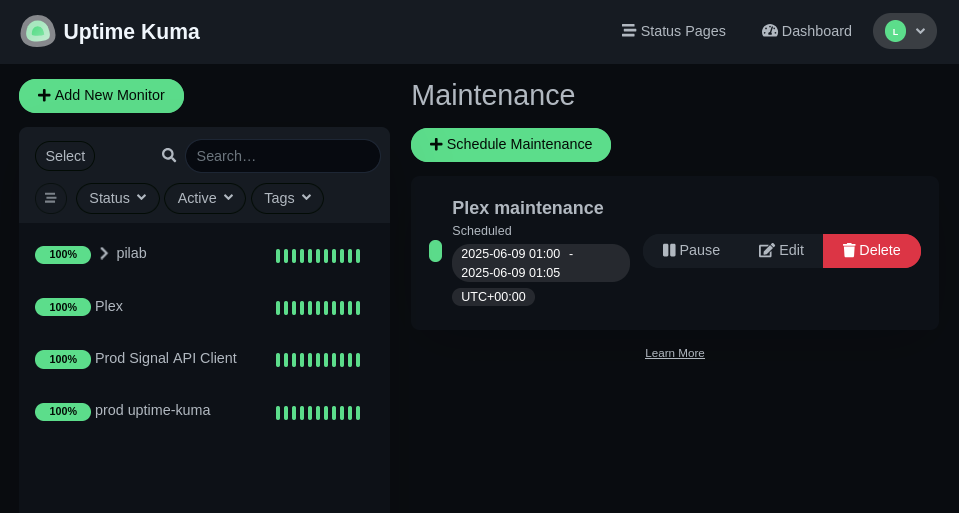
Scheduled Maintenance - yeeeessssss it’s just like being at work. You can schedule a maintenance period for any of your monitors, which silences any alerts during that time. Set a date and time range, add all the affected monitors, and attach a status page:
-
APIs - Uptime Kuma has its own APIs, useful for querying the status information of your monitors (such as when building a custom dashboard in another application), viewing UK performance metrics, creating status pages, managing monitors, or changing the admin settings.
Uptime Kuma makes it so easy to monitor your stuff, what are you going to do with all that time you’ll get back?